AI
Is your company’s annual report silently sabotaging your success?
In today’s fast-paced and interconnected world, data has emerged as the lifeblood of a successful business model. It has become one of the indispensable assets that drive corporate decision-making, fuel innovations, and help companies acquire new customers.
Nevertheless, dealing with numbers and charts doesn’t have to be a daunting task that leaves your overwhelmed. What’s more, there is a way to conquer this challenge and turn it into an opportunity for growth and prosperity.
While the thought of diving into financial data and crunching numbers may seem intimidating, companies practicing the right approach, tools, and mindset handle the task with confidence. Such companies deploy user-friendly templates and intuitive design software to develop a corporate annual report format and put their wins on the big stage.
Sounds promising, doesn’t it? What if we told you Renderforest could help you with report writing samples to simplify your unique annual report format creation process?
Whether you need to showcase financial performance, highlight KPIs, or present your future strategies to the stakeholders and investors, Renderforest has your back! This guide will go through each step of the creative process, providing you with helpful templates, samples, and tips.
So, fret not, and let’s dig in!
When we explore the realm of reports, we encounter a vast landscape of communication methods. Technically, a report can encompass any account, whether it takes the form of spoken or written words and aims to address matters related to a specific topic. From legal proceedings where individuals provide testimonies to the book reports crafted by enthusiastic grade schoolers, the term “report” encompasses a diverse array of contexts.
Yet, when business people use the term “reports,” they typically refer to official documents that present factual information about a particular subject. Such reports enable companies to evaluate investments, analyze data and trends, identify effective solutions, and set strategic goals.
Suppose you own a small business and must present your sales figures to the board of directors. In such case, your annual report format may showcase the company’s financial statements, including income statements, balance sheets, and cash flow statements, providing a comprehensive understanding of its financial health and stability. Even if you don’t have much to highlight, you should still aim to provide a clear overview of the company’s internal and external workflow.
 |
 |
 |
Annual reports serve several key purposes within the business landscape. Here are a few things worth considering:
All these purposes serve a single higher mission: foster transparency and trust among stakeholders and grow credibility for the organization.
A well-established annual report format, in particular, plays a crucial role in communicating vital corporate data to stakeholders, investors, and other team members who may not be directly involved in the day-to-day activities of the organization.
Moreover, annual reports also serve as an informational resource for regulatory bodies, industry peers, and creditors. As such, to convey the data in a precise and digestible manner, it is essential to adhere to the report writing samples and conventions of the particular industry.
The annual report format for a nonprofit organization, profit, or governmental organization should include strategic recommendations to keep the business on track.
Of course, having a well-developed report layout is a must, but before we dive into that aspect, let’s not forget the old saying, “Don’t put the cart before the horse.” When it comes to annual reports, it’s crucial to understand and comply with the regulatory and legal requirements first.
These requirements serve as the foundation, ensuring that the report meets the necessary standards and guidelines set forth by regulatory authorities. So, before we embark on creating a visually stunning report, let’s ensure we have dotted all the i’s and crossed all the t’s in terms of regulatory and legal compliance.
Some common elements include:
Yet for a more in-depth understanding and industry-specific guidelines, consider checking the Code of Federal Regulations, outlining the annual reporting requirements for financial facilities.
The structure and format of annual reports may vary depending on the company’s industry, size, and specific requirements. Just as industries have their own jargon and quirks, the format and structure of annual reports also reflect the particular nuances of each sector.
Yet, looking through some of the best report writing samples, we found a few sections incorporated in almost every document.
So, here’s your beginner cheat sheet to begin with a perfect report layout!
The section includes a letter in which the CEO is expected to express gratitude, provide insights, and share the company’s vision for the future.

In crafting the CEO’s letter to shareholders, it’s important to strike the right balance between formality and conversational tone. After all, you’re addressing individuals who have invested their time, trust, and capital in your company.
Covering financial performance, operational highlights, market analysis, risk factors, and more, the MD&A section should offer insights into the company’s achievements, challenges, and strategies for growth. While the specific content may vary, the goal is to provide clear, concise, and relevant information that helps shareholders and stakeholders understand the company’s performance and direction.
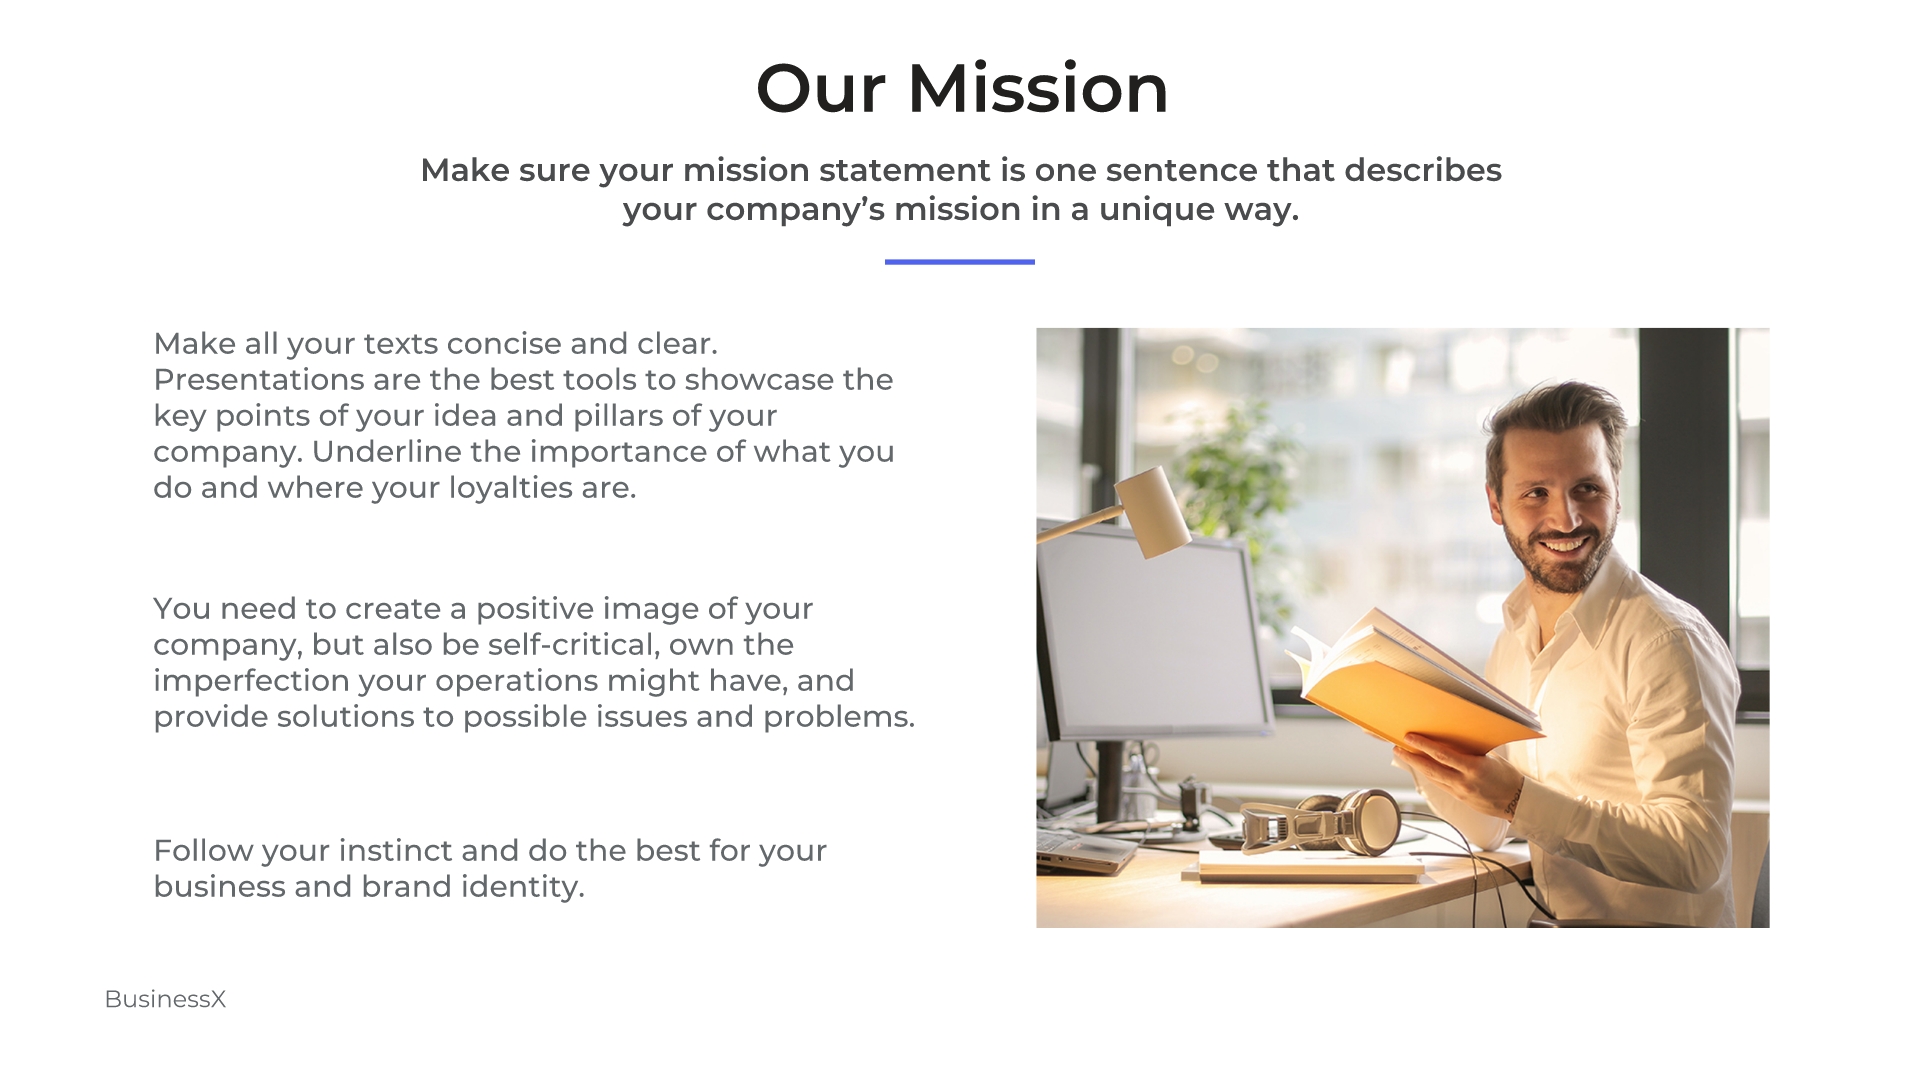
Most of the time, people reading your annual report are those well acquainted with your company’s profile. Still, it’s a good idea to include a brief synopsis of your company’s history, mission statement, and core values.
 |
 |
 |
When your company is a publicly traded entity, you must also include information regarding the corporate structure, board members, executive team members, and other relevant details.
What’s an annual report format without a detailed representation of the company’s financial performance and capital structure?
With a holistic view of the company’s financial health, the report should include an analysis of the company’s key financial metrics, such as revenue growth, profitability margins, cash flow statements, and balance sheets. It should also include the company’s capital structure, debt and equity outstanding, and other related items.
 |
 |
 |
Of course, this is not the complete list of the elements to include in a report. Moreover, some companies depending on their sphere of influence, may or may not need the elements discussed above. It all depends on the specific requirements and industry standards.
Companies operating in regulated industries, for example, may need to include additional sections related to compliance, risk management, or regulatory disclosures.
On the other hand, companies in emerging sectors or technology-driven industries might emphasize sections on research and development, intellectual property, or innovation initiatives.
That said, the content and structure of report writing should be tailored to the company’s unique circumstances and target audience. Nevertheless, design is something that either enhances readability or becomes a distraction.
Impressive reports don’t just simply happen. They require expert craftsmanship, and having a model to follow can save you a lot of time and energy. But here’s the good news: you don’t have to start from scratch! By utilizing report writing samples and professional templates, you can save a significant amount of time and energy.
Having a detailed template at hand will provide you with a proven model to follow. That said, instead of staring at a blank page, you can dive right in, knowing you have a solid foundation to build upon.
As your dedicated supporter in design matters, we will furtherly guide you through a few things to consider when choosing a report model.
Stay tuned if you want to get a free ready-made framework to customize right away!
Are you in a traditional, conservative sector, or are you part of a cutting-edge, innovative field? Understanding the nature of your business will help determine the appropriate tone and visual style for your reports.
For example, if you are in the consumer goods industry, your focus should be creating a visually appealing report that appeals to the general public. However, a more technical and scientific approach is recommended if you are in the engineering sector. In the last case, annual technical reports should feature charts and graphs to illustrate the data. As your target reader will be familiar with the technical terms, a straightforward, minimalist design will suffice.
Next, think about your company’s brand voice.
What colors, fonts, and visual elements represent your brand? Do you aim to convey your business messages through minimalism or eclectic design?
When utilizing professional templates, customize them to convey your company’s unique identity. After all, you don’t want to present a generic-looking report that won’t stand out from the competition.
Here’s the best part you will love!
As Renderforest has a broad spectrum of tools and resources for creating a custom annual report format, you are welcome to customize fonts, colors, and layouts to create a stunning report that reflects your company’s essence.
We are finally poised to move ahead and give you templates for free to develop a perfect report writing format!
Are you tired of traditional, mundane annual report templates that fail to capture attention? Look no further! Renderforest proudly presents its Company Annual Report Infographic Collection – a game-changer in report presentations.
Unlike ordinary templates, this collection offers over 100+ fully customizable scenes, allowing you to create a professional-looking video report presentation in a matter of minutes. Say goodbye to the lengthy and dull annual report format in Word, and embrace the power of visual storytelling!
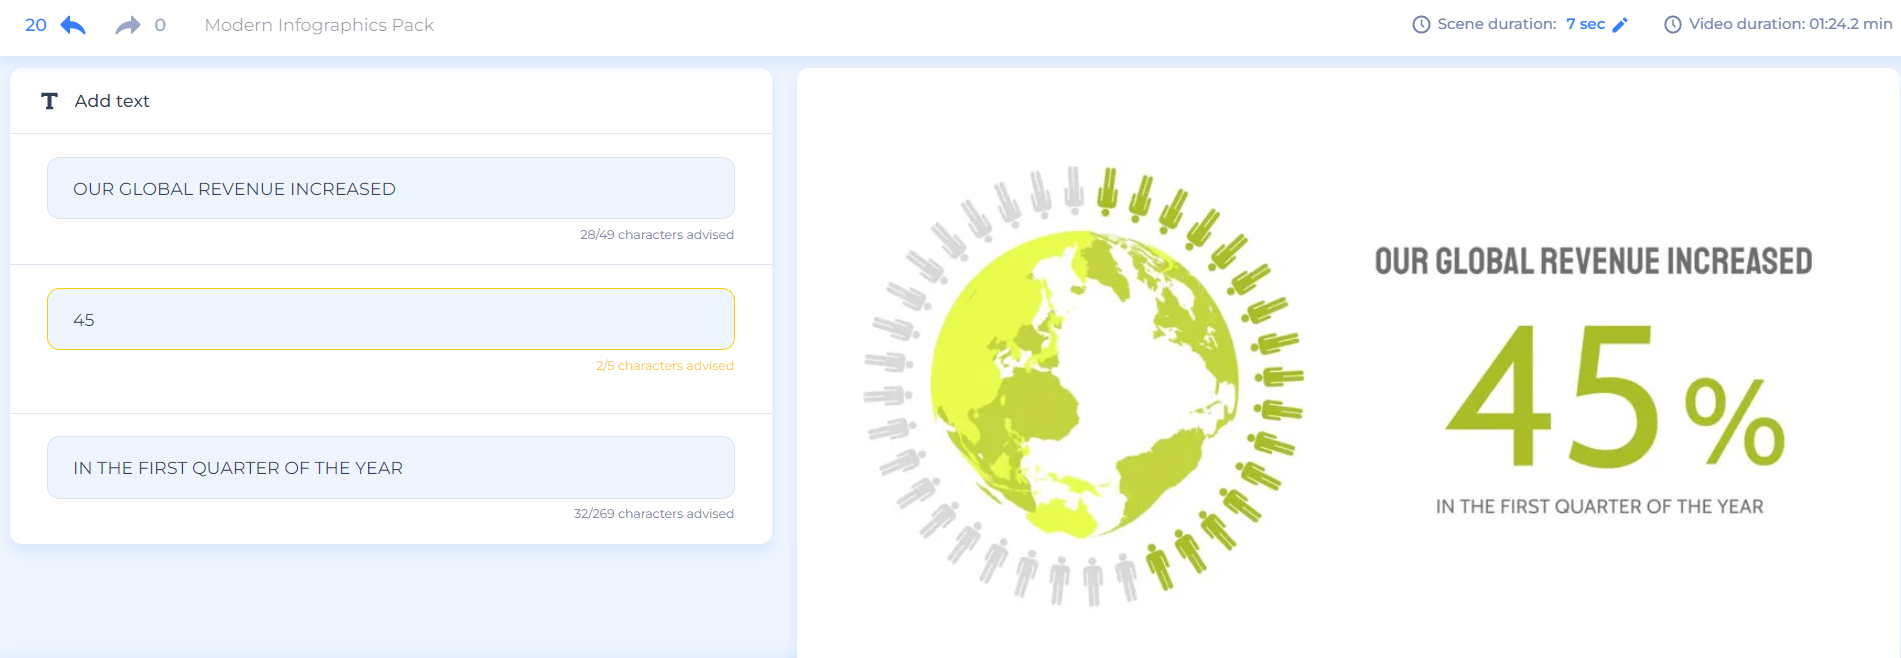
With Renderforest’s unique collection, you can captivate your audience from the first frame. Each scene is carefully crafted to deliver impactful data visualization, stunning animations, and engaging infographics. Whether you want to showcase financial figures, highlight market trends, or emphasize key achievements, these scenes offer the flexibility to bring your data to life.
Simply add relevant information in the corresponding field, and voila! The platform will have it all neatly presented.
Customization is effortless with Renderforest’s intuitive interface. Select the scenes that resonate with your content, add your data, and watch as your report transforms into a dynamic and visually striking video presentation using a corporate video template. You have the freedom to tailor the colors, fonts, and transitions to align with your company’s branding, ensuring a cohesive and professional look.

Another unique chance to present a monotonous and uninspiring report in a unique video format that will revolutionize how you share your data.
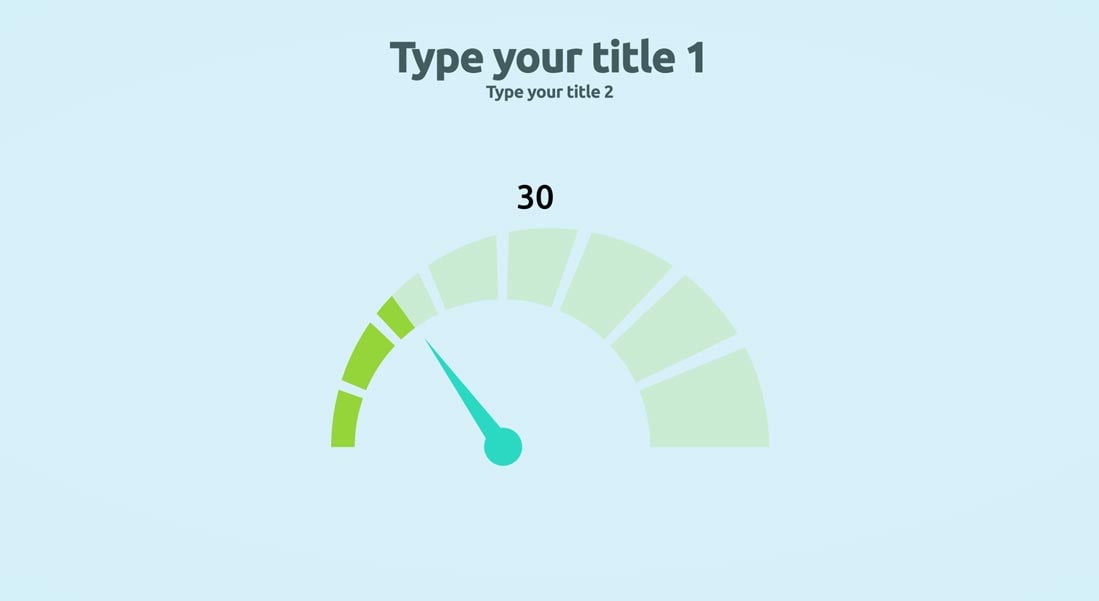
What sets this template apart is its ability to transform dull reports into a fascinating visual storytelling experience. With animated infographics, dynamic charts, and captivating visuals, your monthly reports will captivate your audience and leave a lasting impression.
The best part? You don’t need to be a design expert to customize this template. Renderforest’s user-friendly interface makes it effortless for users lacking design skills to create professional-looking presentations. Simply input your data, choose the animated elements that best represent your information, and watch as your report comes to life with stunning visual effects.

Gone are the days of static bar charts and uninspiring tables. This template combines the power of storytelling and visual communication to engage your audience on a deeper level. Whether you’re showcasing sales figures, performance metrics, or project updates, this template helps you deliver your message with impact and clarity.
If you are looking to elevate your reports to a whole new level of creativity and impact, then this creative pack is designed for you. Already used by 78K+ experts, this template pack is designed for those who want to break free from traditional report formats and infuse their presentations with a touch of creativity.
What sets this pack apart is its flexibility. Users are free to alter the scenes as needed, add their own images, and choose the desired soundtrack. This allows you to create a unique and personalized report that reflects your company’s style and messaging.
 |
 |
 |
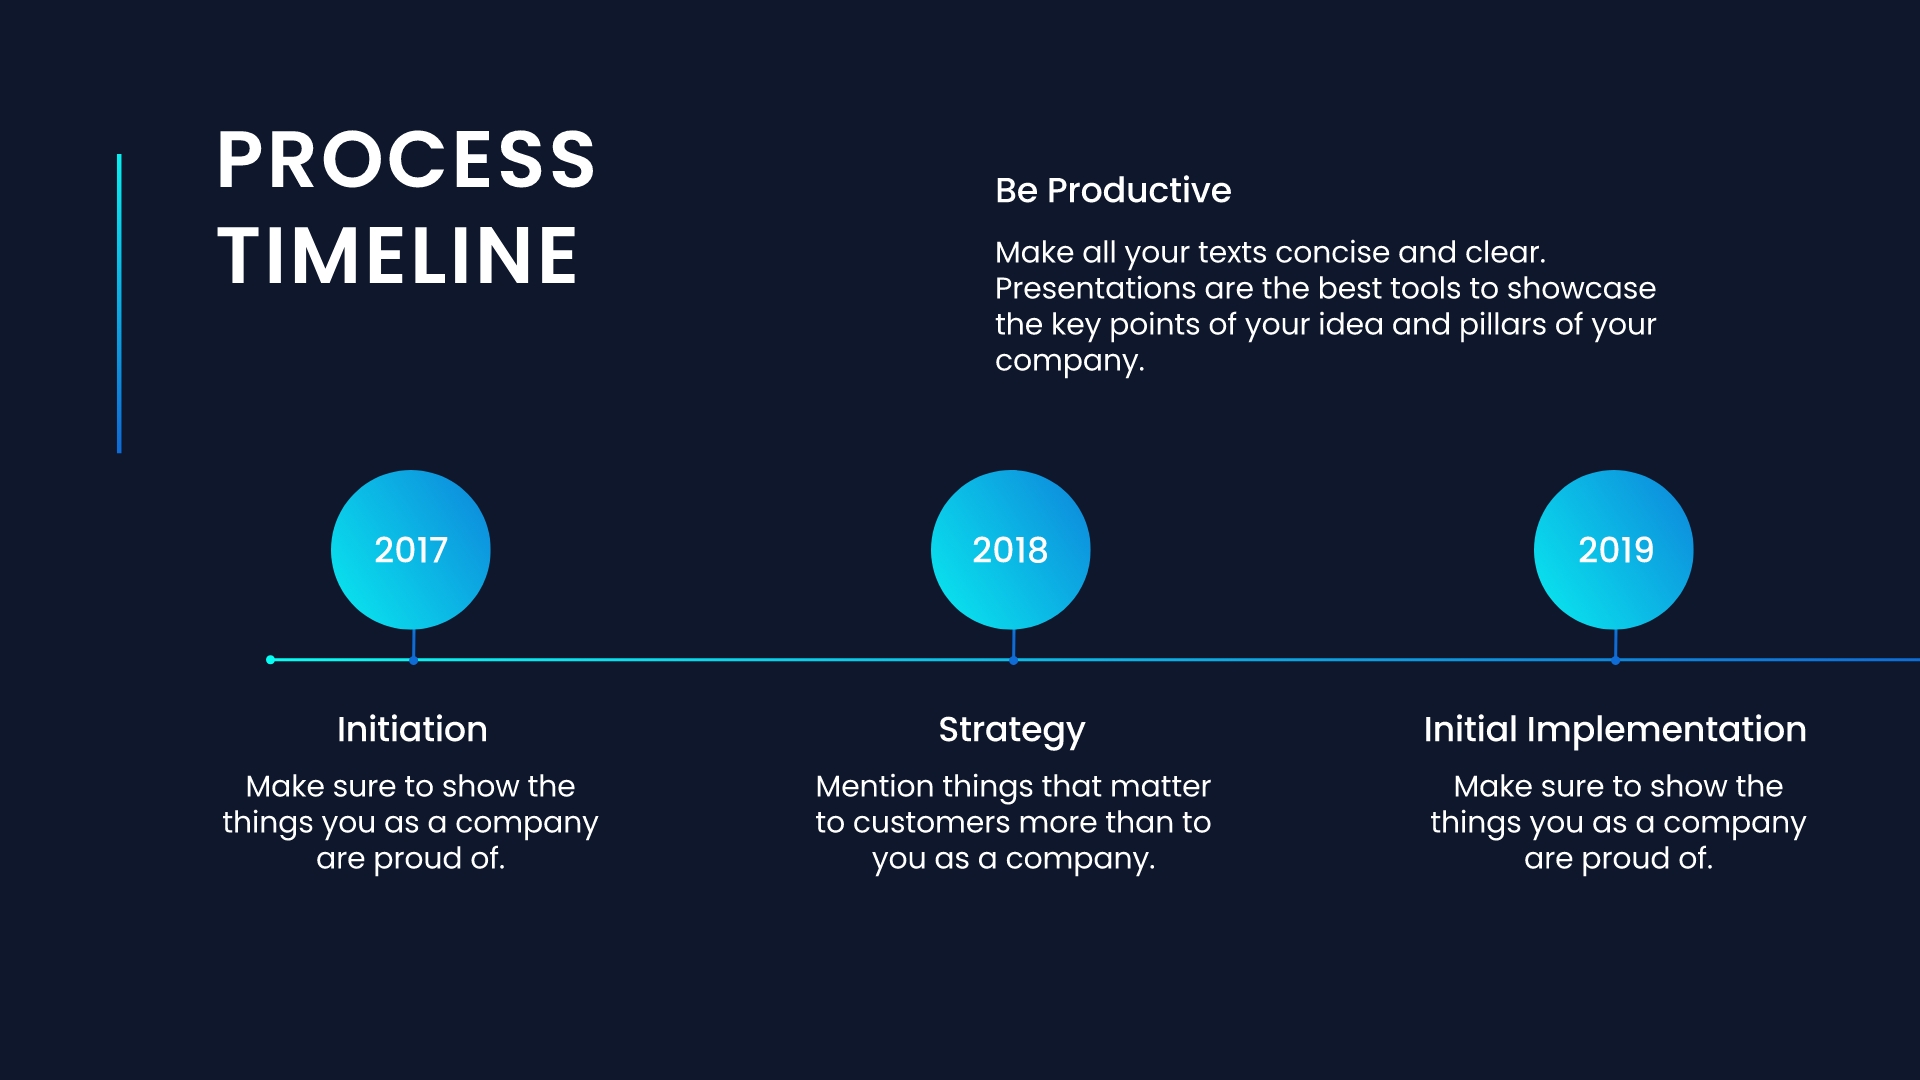
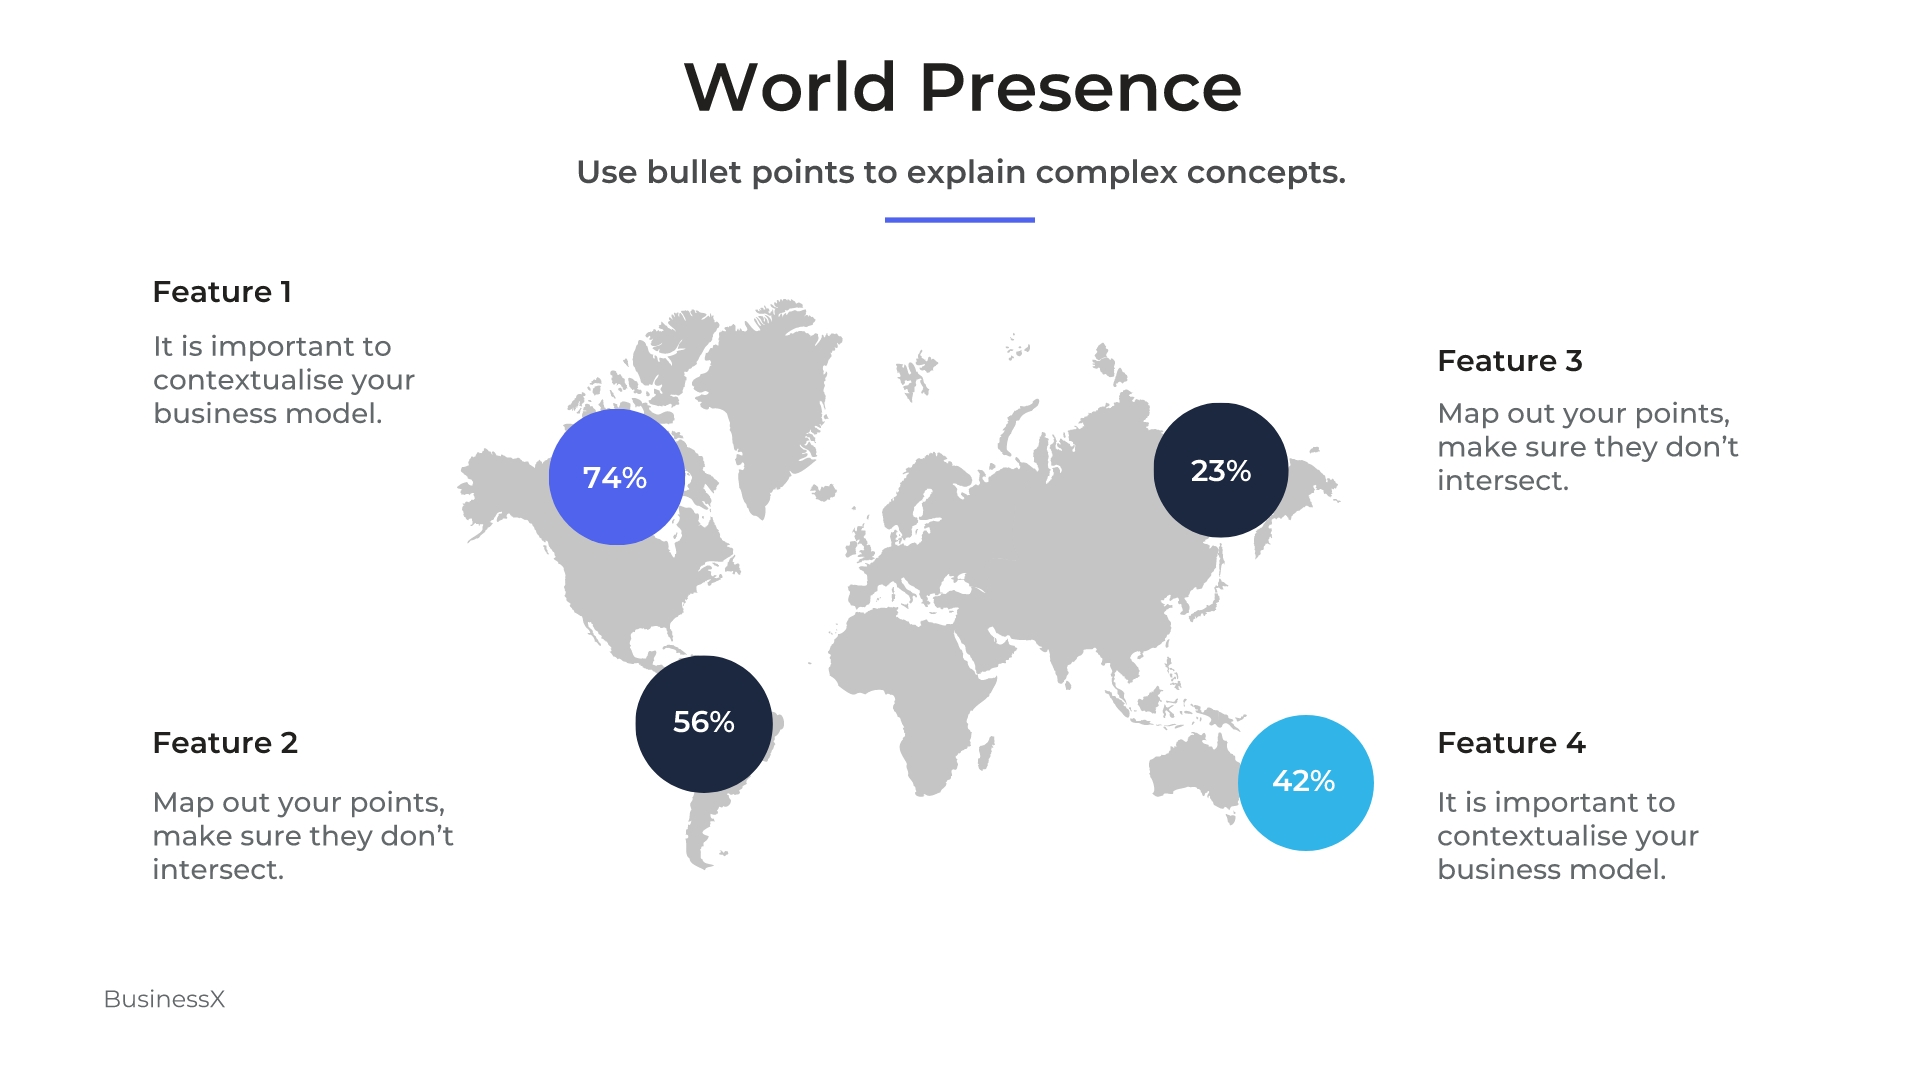
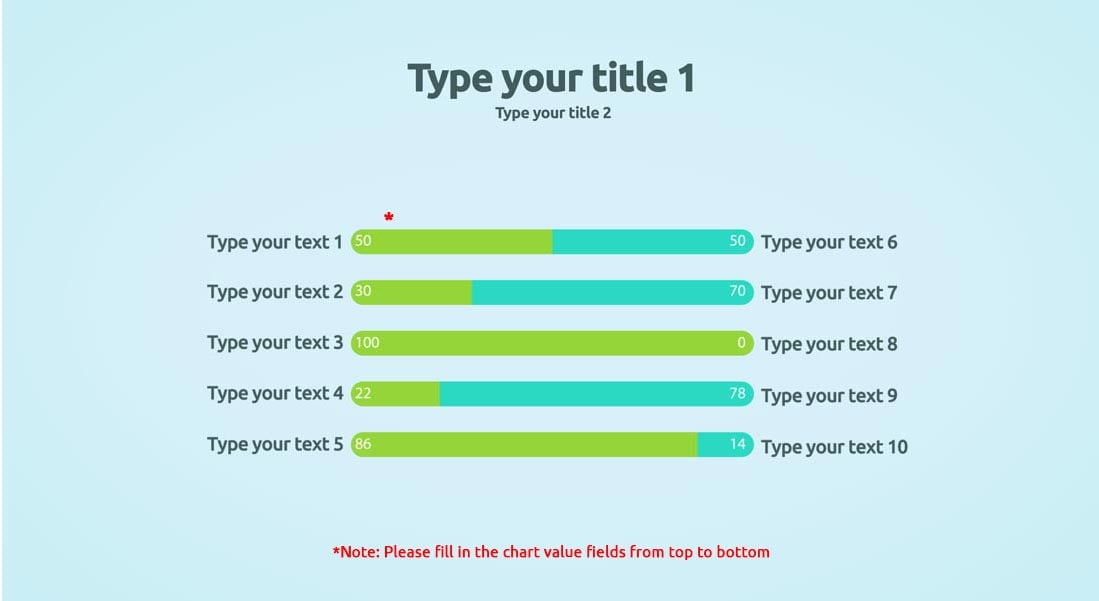
From self-filling charts to infographics and timelines to maps, you can create dynamic presentations that engage your audience.
The creative report presentation is well-suited for marketing teams and companies. Some of the use cases include but are not limited to the following:
Do you still want to have the good old PDF format report but be sure it won’t fail to make an impact? If yes, we have an exciting suggestion for you!
Why not explore our versatile business presentation templates and wow your audience? Besides the ability to customize the look and feel of your report, you can also use pre-defined layouts, diagrams, and maps to make your report more compelling.
Here are a few things we are thrilled to offer you!
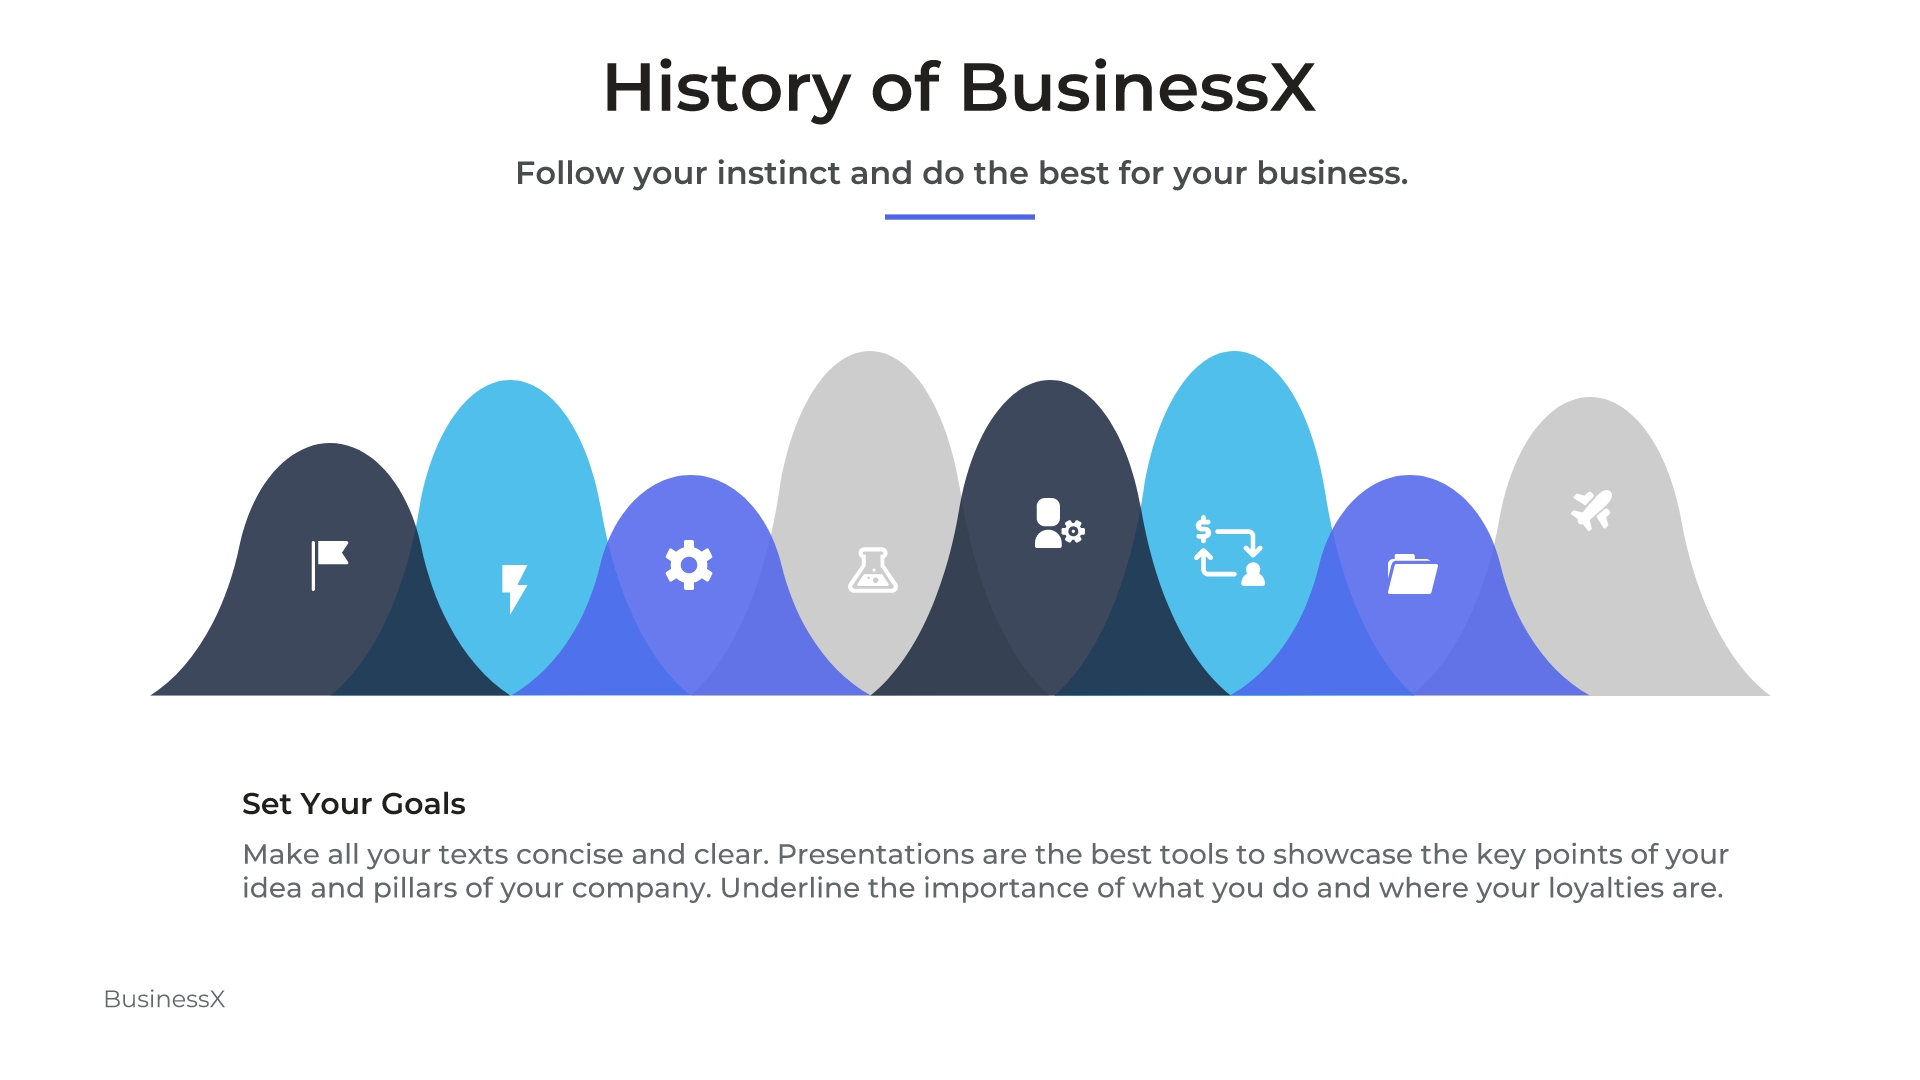
Our business presentation templates offer a wide range of slide designs specifically tailored for corporate reports. Whether you need to showcase financial data, highlight key achievements, or outline strategic plans, you’ll find the perfect slide to communicate your message effectively.
In fact, the design elements are much like those you would find in the infographic videos discussed above. Yet, the variety of design options and intuitive interface make the experience simpler and less time-consuming.
 |
 |
 |
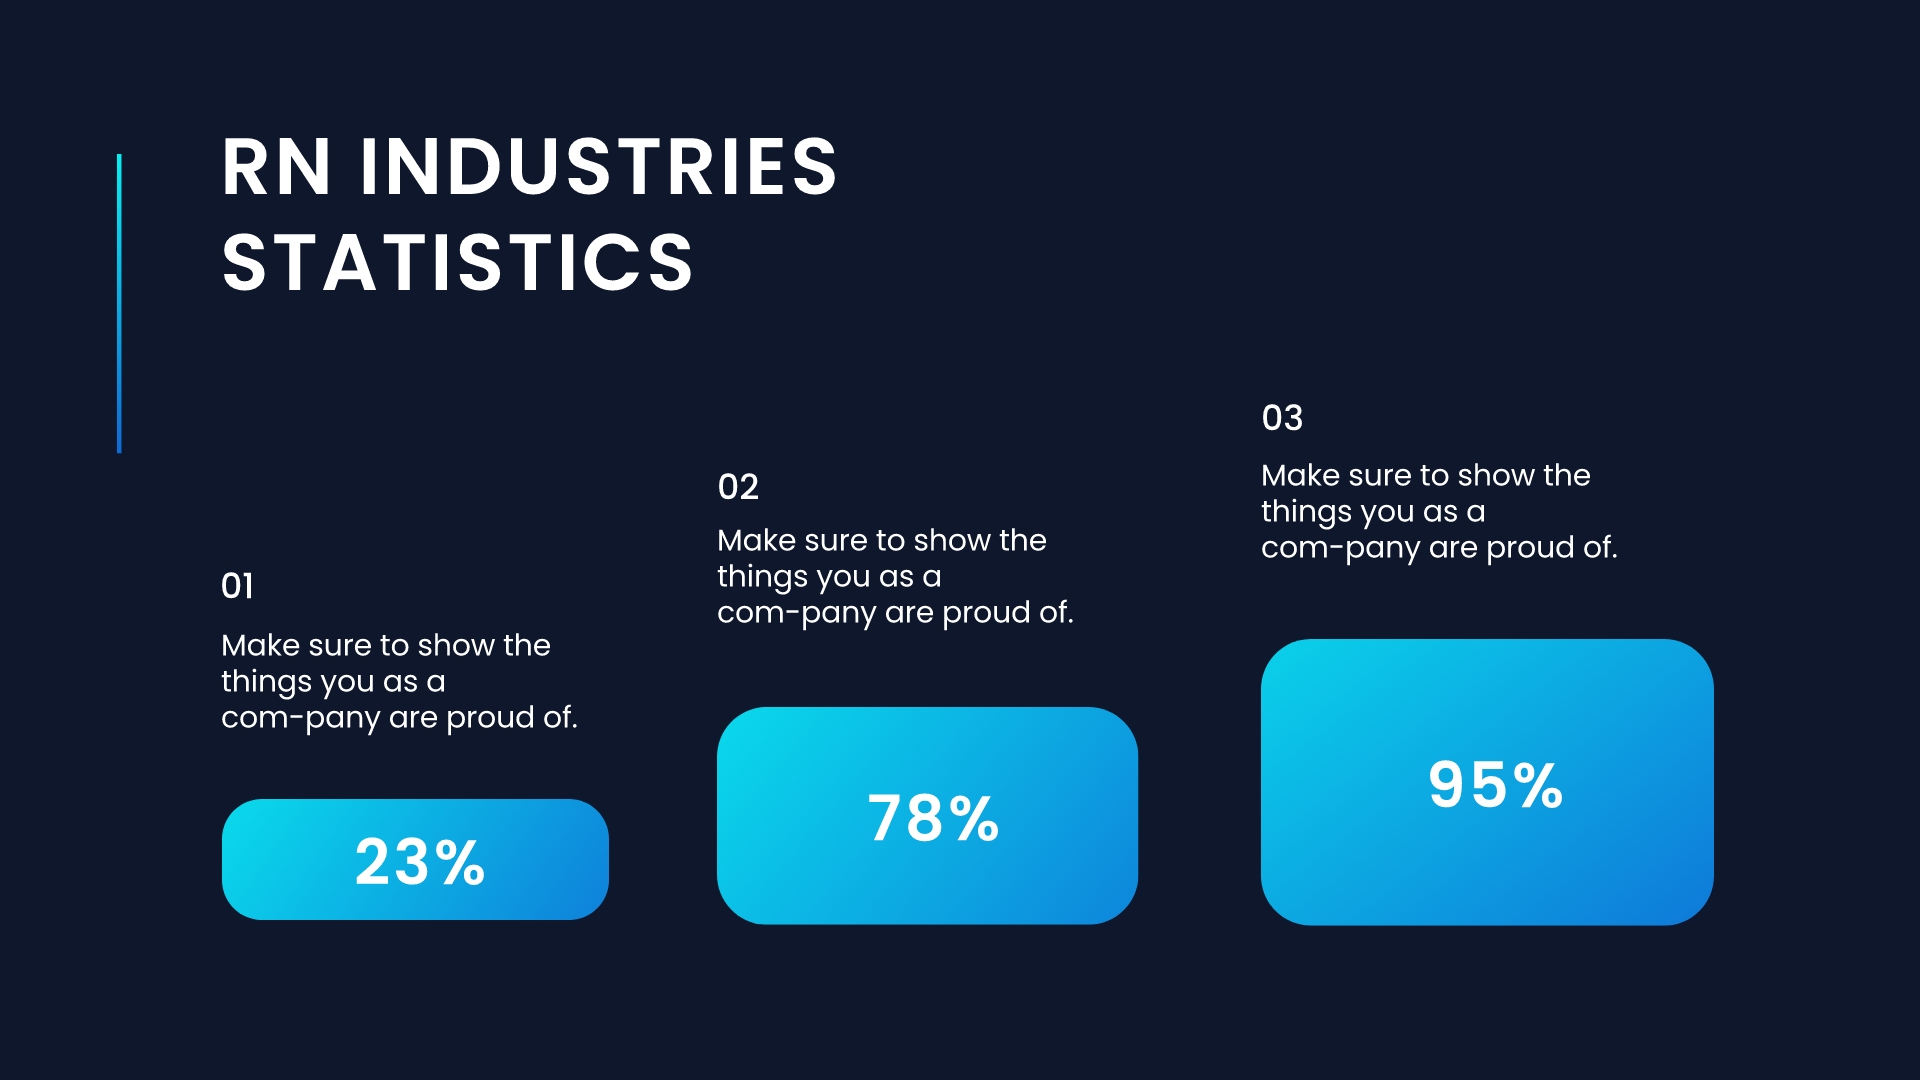
As a result, you are welcome to emphasize the company’s priorities in a way that will keep your audience engaged throughout the report.
Mix and match the slides to get a perfect combination of professional and outspoken design. Renderforest’s sleek and modern templates are not only visually pleasing but also incredibly easy to customize.
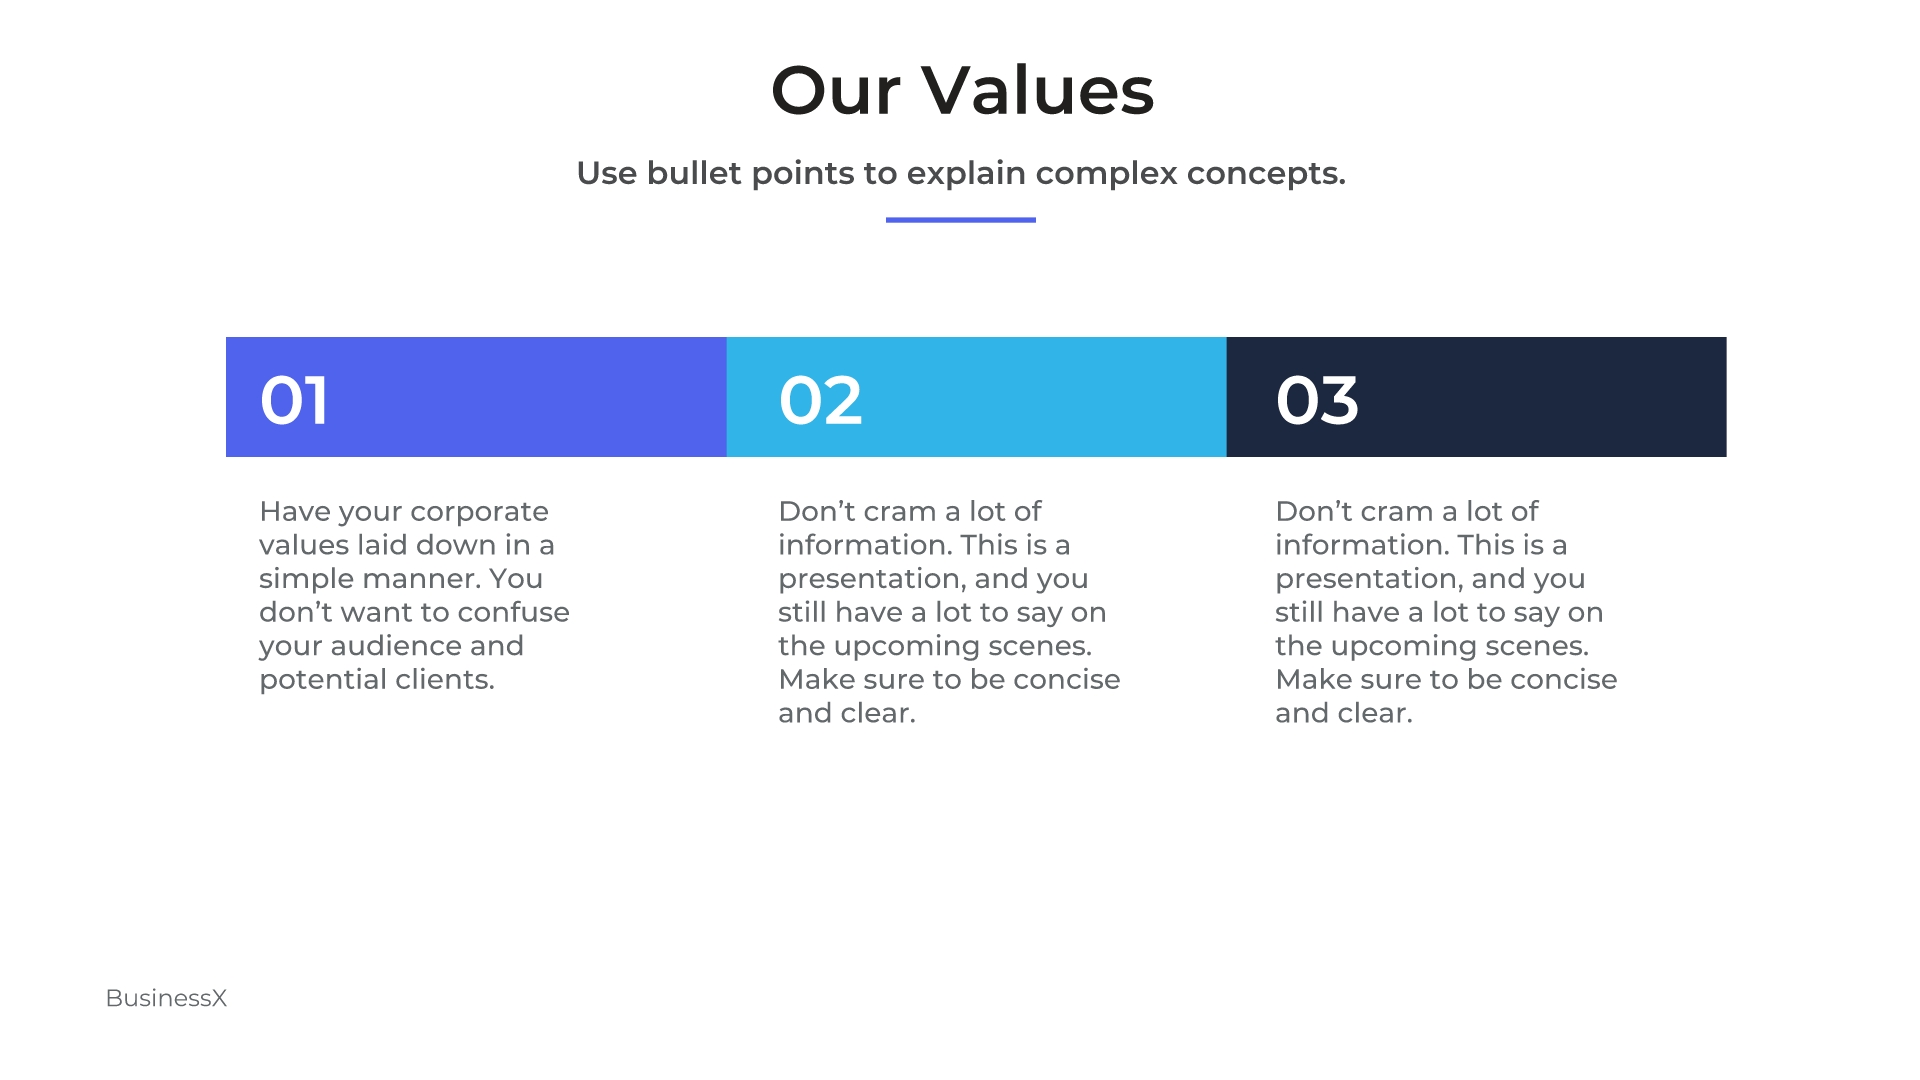
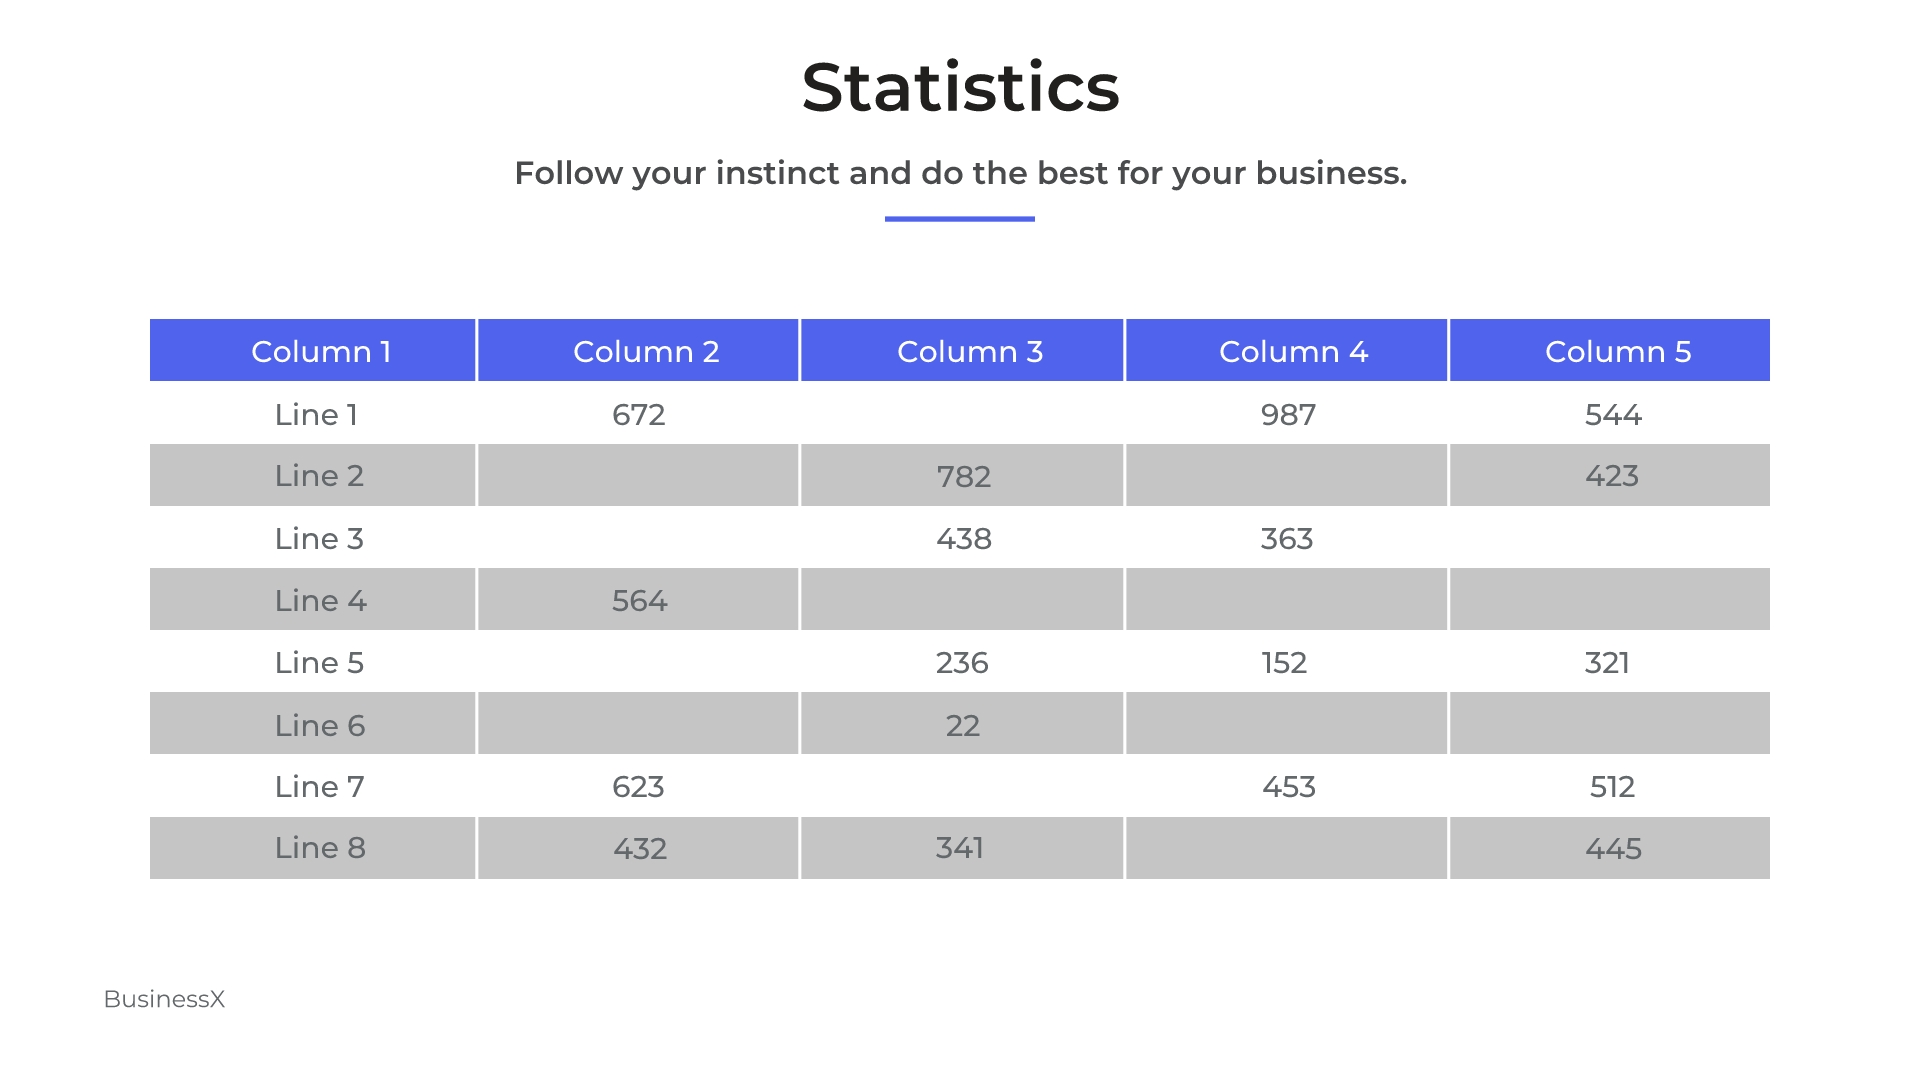
We understand that time is of the essence regarding report preparation. That’s why our templates come with pre-defined layouts, allowing you to structure your report efficiently. Whether you need an executive summary, a section for market analysis, or a project timeline, you’ll find ready-made layouts that can be easily customized to suit your specific needs. Choose from hundreds of elements, such as charts, graphs, diagrams, and icons, to organize your report.
 |
 |
|
Remember, it’s not just about presenting information; it’s about making a lasting impression. Go the extra mile with Renderforest and learn how to make reports that stand out from the rest. Your audience will thank you for it!
Do you want to learn the secrets behind creating compelling data presentations that captivate your audience?
If you’ve come this far, you are not the type who settles for the easy way out. Keep reading and learn how to make your annual report stand out!
We are about to delve into some of the best practices experts use to juggle numbers and have effective visual storytelling at the same time.
Accurate data is the foundation of any successful data presentation. When the information you present is not accurate, it can lead to misinterpretation, confusion, and ultimately, poor decision-making.
To ensure accuracy, start by verifying the data from reliable sources. Double-check the data entries, perform data validation checks, and reconcile any inconsistencies. It’s also essential to review the data presentation for any errors or inaccuracies, such as incorrect calculations or misleading visuals.
When presenting data over time or comparing different datasets, set and follow clear guidelines to maintain consistency in formatting, units of measurement, and labeling.
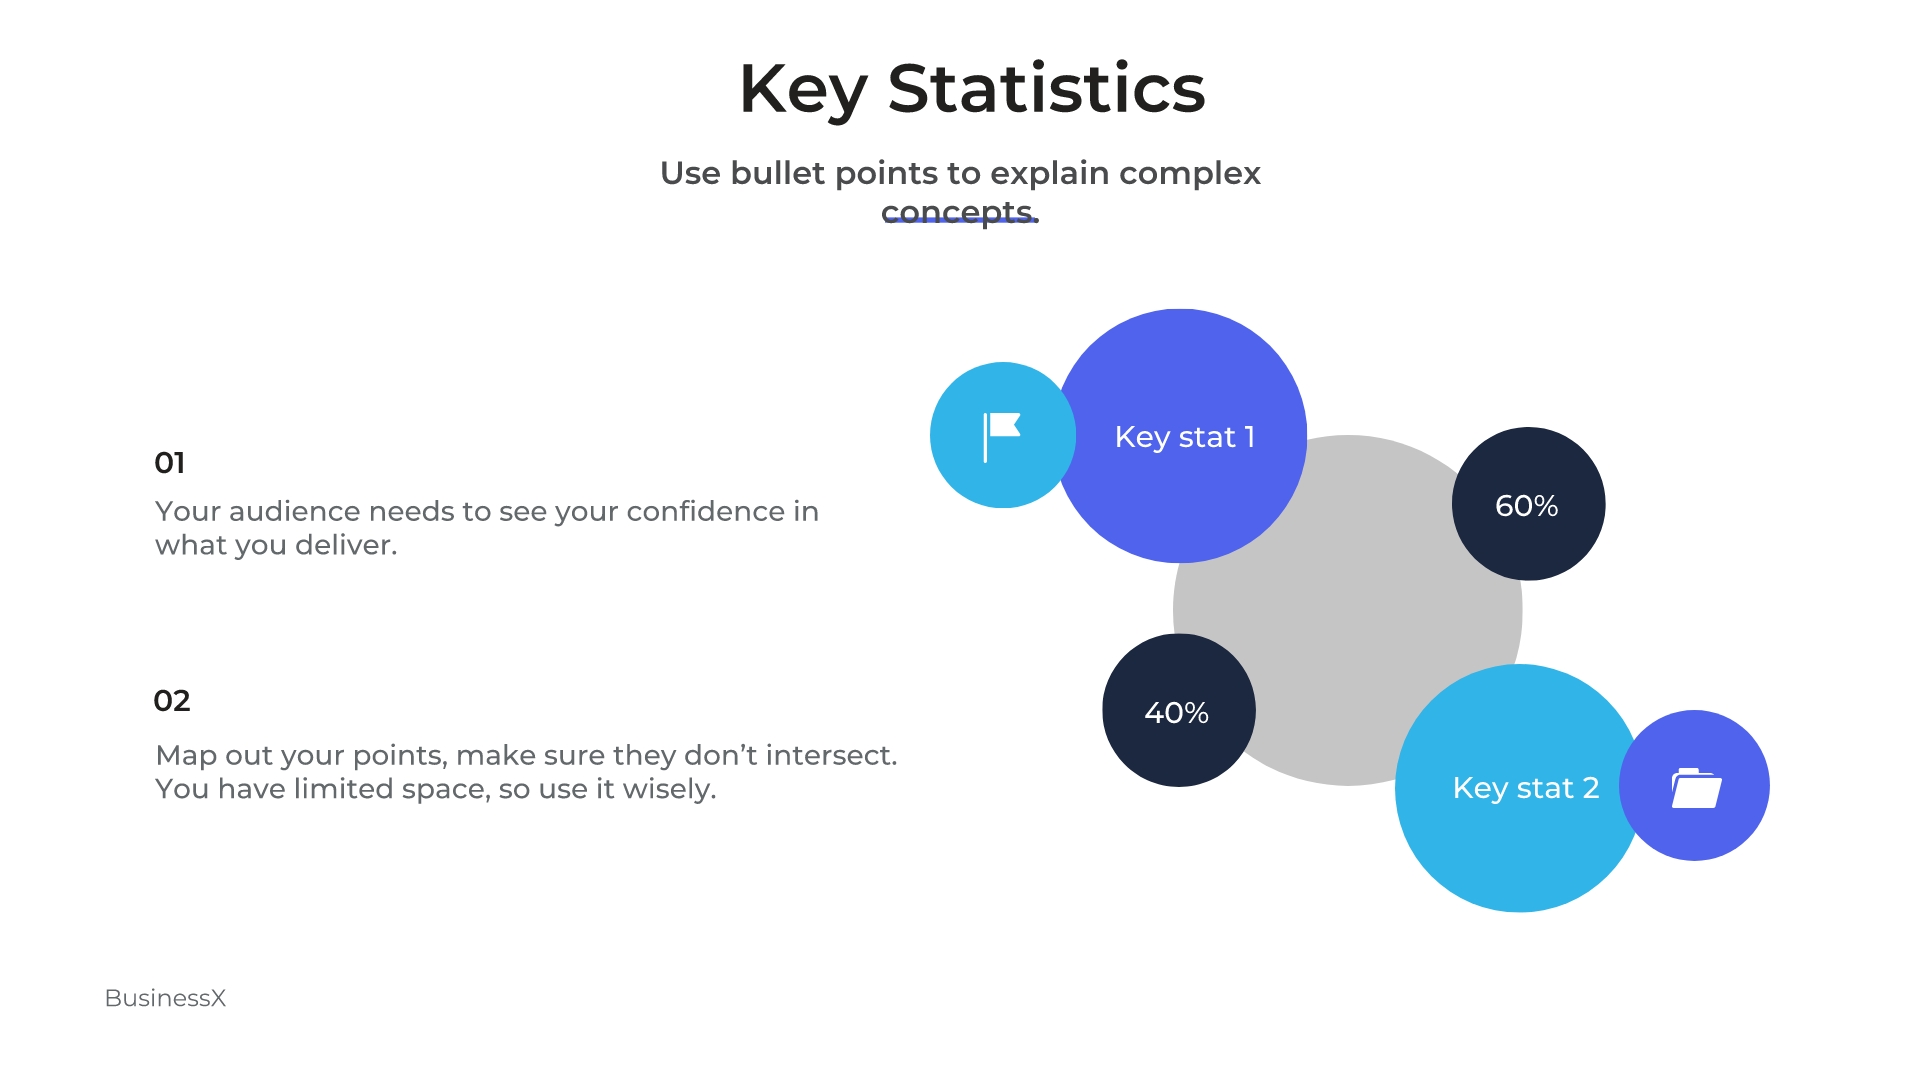
Financial data can be complex, so it’s important to present the metrics in a way that is easy to understand. Use charts, graphs, and tables to present the data visually and highlight the key findings. Avoid cluttering the presentation with excessive information and focus on the most critical metrics that support your narrative.
Focus on the visual data representation but stay alert not to have an opposite impact by overusing those.
Visual aids offer several advantages over presenting raw data.
Add line charts to show trends over time, bar charts to compare different categories, and pie charts to illustrate proportions. Additionally, consider using color coding, annotations, and callouts to draw attention to specific data points and insights.
When creating visualizations, keep the following tips in mind:
To make your data presentation more engaging and memorable, connect the data with a narrative. Explain the context and the story behind the data, highlighting its relevance and implications. Use real-world examples to illustrate the data’s impact and make it more relatable to the audience.
Data can sometimes be overwhelming, especially for non-technical audiences. To simplify complex data, use metaphors and analogies that relate to everyday experiences. For example, you can compare sales growth to a rocket taking off or use a traffic light analogy to represent performance indicators.
And there you have it! All the information you need when it comes to creating a presentation for your annual report.
Remember, the power of data is amplified when presented effectively. By utilizing the right format and incorporating visually appealing templates, organizations can effectively communicate their achievements, financial performance, and future goals to stakeholders.
Today you’ve learned some of the most sacred report-making tips!
Remember, with Renderforest, these and more are possible with its advanced and AI-powered functionality.
Take your data presentations to new heights and captivate your audience with stunning visuals and compelling storytelling!

Share this
Article by: Renderforest Staff
Dive into our Forestblog of exclusive interviews, handy tutorials and interesting articles published every week!
Read all posts by Renderforest Staff